Tutorial - Dynamic Reports
In this next tutorial we are going to look at ways of adding a page for exploring records. As this is an advanced tutorial we’ll be building a page with a map plus grid of records and putting them on 2 separate tabs. There are a few possible approaches to building such a page, but the one that combines simplicity with the most flexibility is to use the Reporting page (customisable) prebuilt form. This form takes a similar approach to the Form Structure configuration options of the Sample and Occurrences Form but instead of laying out form components, you are laying out report components.
Setting up a website agreement
Website agreements are a feature of Indicia that allow websites to report on records from other websites. For example, iRecord acts as a centralised portal allowing reporting on records which were input via a number of different websites. It also allows verification of records from other sites - the websites which will participate in this arrangement are configured using a website agreement.
For more information on website agreements, see Website Agreements.
Although in many cases setting up a website agreement is not necessary, since we are about to use some of the reports originally designed for iRecord which depend on website agreements, we will need to set one up before proceeding. Here are the steps:
Log into the warehouse with full admin rights if you are not already logged in.
Select Admin > Website Agreements from the menu.
Click the New website agreement button.
Since we are only creating an agreement for the single website we are working on, there is no need to set anything on the website agreement’s edit page other than the Agreement title. Normally you would define what kinds of tasks the agreement allows records to flow between websites for. So, set the title and save the agreement.
Now, we need to add your website into the agreement. Select Admin > Websites from the menu then click the edit link for your website registration. Select the Agreements tab.
Click the Join website agreement button.
On the New Websites Website Agreement page, set the Agreement to participate in to the title of the agreement you just created. Normally you would need to specify which parts of the agreement your website wants to opt into, but that is not necessary for our purposes. For example, the iRecord agreement allows participating websites to provide records to iRecord’s reporting pages or verification pages, but it is up to each website which of these they want to opt into. Press Save.
Tip
If you haven’t already done so, now would be a good time to add a handful of records to
the database using one of the forms you have built previously. Also, since the
reports we are going to use depend on the cached version of the tables, if your
warehouse does not have the scheduled_tasks process automated then you will need
to visit the link yourself to force the tables to populate. On my development machine
this link is http://localhost/indicia/index.php/scheduled_tasks.
Adding the report page
Select Content > Add content > Indicia pages from the admin menu of your Drupal website.
Set the Page title to “Explore Records”.
Expand the Menu settings section and set the Menu link title to “Explore Records” to add it to the menu. You can reorganise the exact layout of the menu after saving the form if you like.
In the Form Selection section, set the Form Category to Reporting and the Select Form drop down to Reporting page (customisable).
Click the Load Settings Form button.
Let’s just do the minimum to get the form working for now. Expand the Base Map Layers section and tick the Google Streets and Google Satellite base layer boxes.
Click the Save button at the bottom.
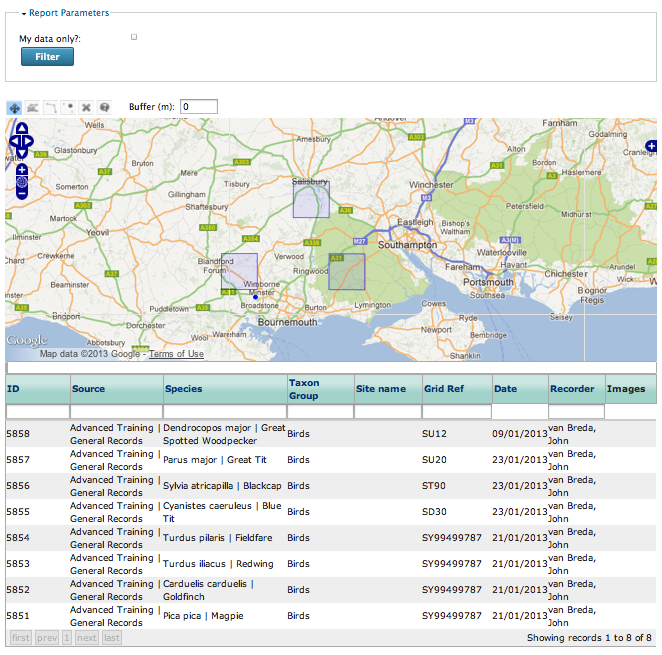
Ok, we should have a working report page, even if there are a few tweaks we’d like to make:
Configuring the report page
The report page already has lots of functionality:
Map of the records
Grid of the records
Filtering by typing into the box at the top of each grid column
Sorting and pagination in the grid
Filtering by drawing polygons or lines on the map
Choice of background layers selectable using the blue + button in the top right of the map.
There are a whole bunch of things we can do to improve this page though, so lets start working through a few of them. First, we’ll merge the filter panel into the map toolbar to save space:
Edit your report page, then find the User Interface section and expand it.
In the Form Structure box, find the
[params]control and add the following on the next line:@paramsInMapToolbar=trueSave the page.
That should have tidied the top of the page up a little.
Tip
The [params] control is output by the report_helper::report_grid method, with
the ParamsOnly option set to true. Therefore the options you can override for this
control are defined at http://www.biodiverseit.co.uk/indicia/dev/docs/classes/report_helper.html#method_report_grid.
Next, lets convert our user interface into a tabbed layout:
Edit your report page, then find the User Interface section and expand it.
Set the Interface Style Option to “Tabs” then save the changes.
Now we have the user interface organised onto 2 separate tabs.
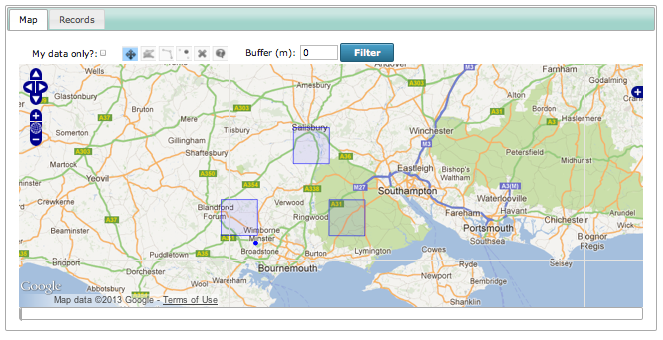
Tip
A really nice feature is that the grid content will only load on the 2nd tab when the tab is first viewed, so you can add lots of tabs with different reports without affecting the initial page load time.
More info on the Form Structure
The Form Structure box on the Edit tab contains the following content:
[params]
@dataSource=library/occurrences/explore_list
@paramsInMapToolbar=true
=Map=
[map]
@dataSource=library/occurrences/explore_list
=Records=
[report_grid]
@dataSource=library/occurrences/explore_list
As before, we can add tabs using =tab name= and we can add reports using the [report
grid] control tag; note that you will always want to specify the @dataSource
property to define which report to load. If you do add different reports, that’s fine
as long as each report you add uses the same set of parameters as the report you’ve
used for the [params] control tag, so that you only have to fill in one set of
parameters for all reports. At the moment you will need to look in the XML file for
each report on a copy of the warehouse to check the parameters, though in future we hope
that Indicia will be able to do this for you.
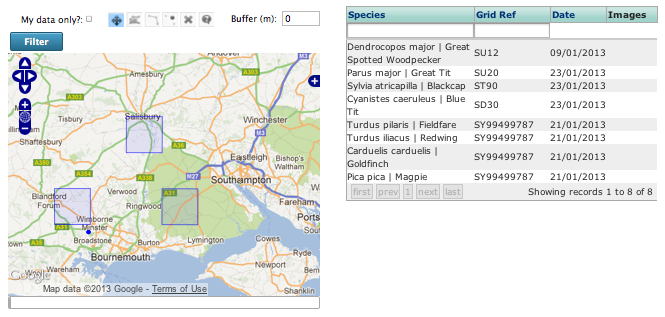
Let’s see if we can change our page layout to a two column layout, rather than a tabbed layout:
Click the Edit tab on your page and find the User Interface configuration section.
Set the Interface Style Option back to “All One Page”.
Paste the following into your Form Structure. This removes the tabs and puts a two column splitter (|) between the map and report:
[params]
@dataSource=library/occurrences/explore_list
@paramsInMapToolbar=true
[map]
@dataSource=library/occurrences/explore_list
|
[report_grid]
@dataSource=library/occurrences/explore_list
Save the page.
That all works, except our grid no longer fits very well in the column space. We could use some custom CSS to change the size of font in the grid, but a better approach might be to only show a selection of the columns available. Here’s how:
On your copy of the warehouse, find the reports/library/occurrences/explore_list.xml
file and open it in a text editor. Don’t worry if this does not make sense, you only
need to look for the list of column definitions in the report:
Each of the name attributes tells us the name of a column we can add to the grid. By checking the display attribute we can map each output column to the title of the column in the grid. So, lets built a grid which shows only the following columns:
taxon
entered_sref
date
images
That means we need to remove the following columns (we only need to remove the ones that
don’t already have the visible attribute set to “false”):
occurrence_id
source
taxon_group
location_name
recorder
To do this:
Click the Edit tab on your page and find the Report Settings configuration section.
Find the Columns Configuration List setting.
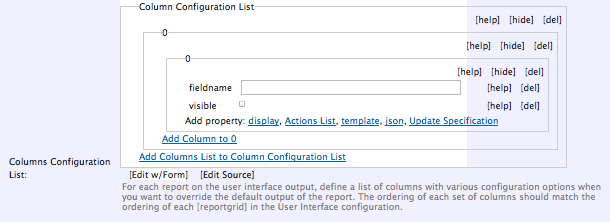
Click the Add Columns List to Column Configuration List link. This adds a list of column definitions for the first grid on the report output. If you have more grids then you can add more columns lists.
Click the Add Column to 0 to add a column to list 0 (which is the list of columns attached to the first grid, since computers like to start counting at zero).
Click the fieldname and visible links in the Add property area. Your configuration should now look like this:
Now, fill in the fieldname input box with the first column we want to remove, which is “occurrence_id”. You can leave the visible checkbox unchecked, which will hide the column.
Repeat steps 4-6 for each of the columns we want to hide.
Now save the page and check that the grid columns visible have been correctly updated:
A Challenge
If you have time, see if you can put what we have learnt into practice to add a 2nd tab to our page layout with a repeat of the records grid, but this time showing all the available columns. You could call this a “Details” tab.